Nvidia DCGM Exporter
Introduction
In this guide we will enable monitoring of NVIDIA GPUs with Grafana. We will be using dcgm-exporter which is an offician NVIDIA repo. We will be running dcgm-exporter in Docker, adding the job to Prometheus, and finally importing a dashboard. I use Portainer to manage my Docker containers, and Termius to manage my SSH sessions. If you use something different you will need to make adjustments as necessary
You should have completed the following:
- Install Docker
- Set up Portainer
- Install NVIDIA Drivers
- Set up NVIDIA GPU for Docker
- Set up Prometheus & Grafana
These are all pretty quick to get through, and will set you up for the next step.
Deploy dcgm-exporter
Set Up Monitoring network
Although dcgm-exporter will work on any docker network, I put all of my monitoring containers on my 'monitoring-network'. To create this it can be done via docker-cli
sudo docker network create \
  --driver bridge \
  --subnet 172.20.0.0/16 \
  --gateway 172.20.0.1 \
  monitoring-network
Stack File
Create a new stack file and name it dcgm-exporter. Then paste in the following code
services:
  dcgm-exporter:
    image: nvidia/dcgm-exporter:latest
    container_name: dcgm-exporter
    restart: unless-stopped
    runtime: nvidia
    environment:
      - NVIDIA_VISIBLE_DEVICES=all
    cap_add:
      - SYS_ADMIN
      - DAC_READ_SEARCH
    privileged: true
    ports:
      - "9400:9400"
    networks:
      monitoring-network:
        ipv4_address: 172.20.0.12

networks:
  monitoring-network:
    external: true
dcgm-exporter uses port 9400. If this port is already in use, you can update the host port to another number by changing the first part of the mapping. For example: 9500:9400 will use port 9500 on the host machine instead.
Deploy the stack. Check the logs to look for errors. You may see the below error, but it should not cause any issues.
time="2024-10-11T14:57:12Z" level=info msg="Not collecting DCP metrics: Error getting supported metrics: This request is serviced by a module of DCGM that is not currently loaded"
Add to Prometheus config
Now that the Docker container is deployed, the dcgm-exporter job needs to be added to Prometheus. My Prometheus config is located at ~/prometheus/config.yaml
nano ~/prometheus/config.yaml
Add a section for the new job, mine looks like
  - job_name: 'dcgm-exporter'
    static_configs:
      - targets: ['172.20.0.1:9400']
        labels:
          instance: 'milton'
- A new job called
dcgm-exporteris added - The gateway of the
monitoring-networkis added, NOT the IP of the container. If the Docker container is running on a PC that is not the same as Prometheus, then use the internal IP of the PC and not the Docker gateway. - A label that denotes the name I have given to my PC is added, and can be exposed in Grafana
Save the file with CTRL + x and then y and finally ENTER. Restart the Prometheus docker container for the changes to reflect.
Import a Dashboard
A few people have been been kind enough to create a dashboard for dcgm-exporter. To try them out open up Grafana, go to "Dashboards" select "New" and then "Import". Not all the charts may work, and I usually delete the ones that do not and add my own.
Grafana Dashboard - ID 12239
In the input box for the dashboard URL or ID, enter one the above ID and click "Load". Give your dashboard a name, update the UID to be something a bit more specific, and select your Prometheus data source.
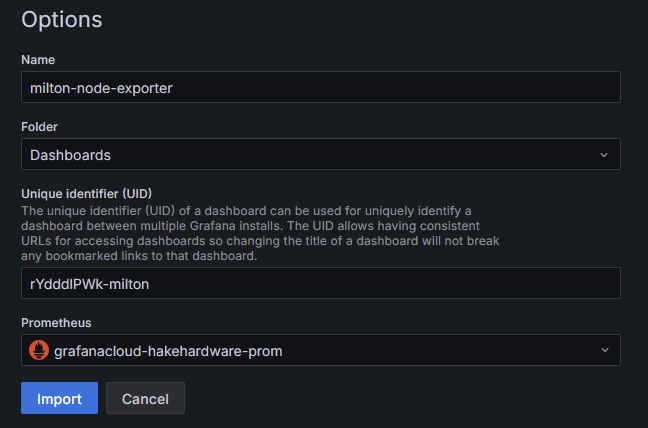
Then click "Import". You should see something like this
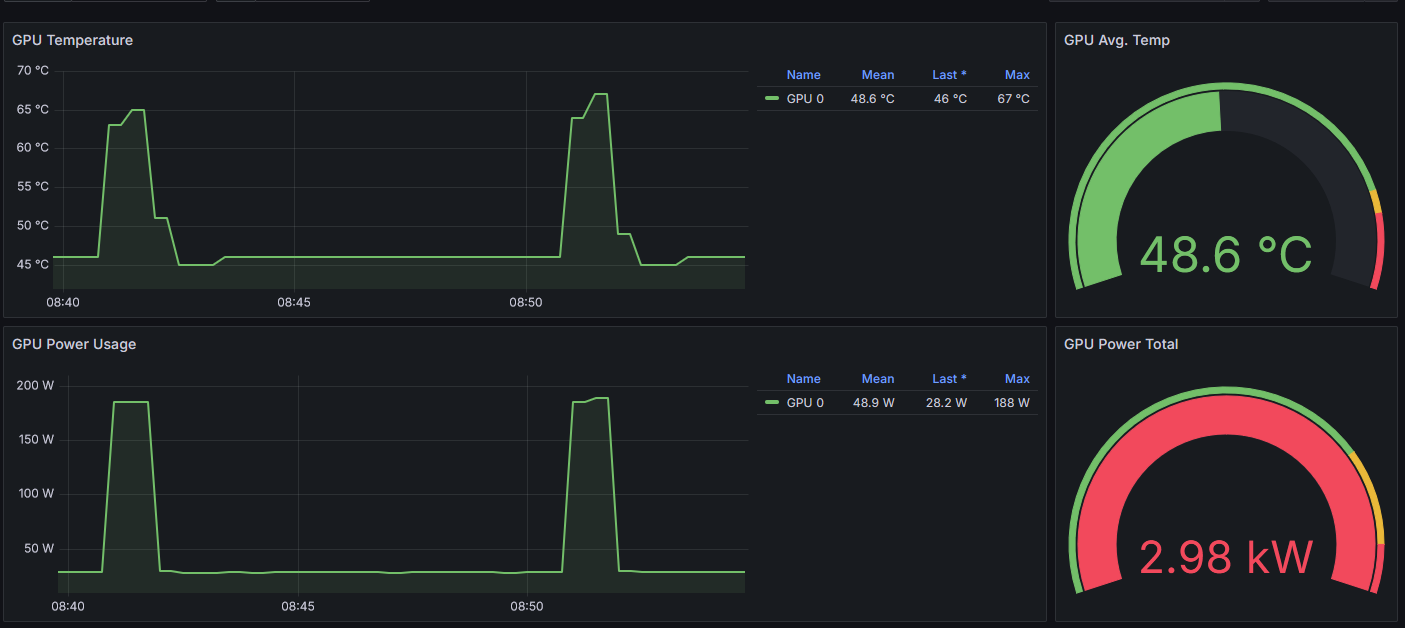
I like to resize things and reconfigure a few of the dashboards, but this is a great start. The things I usually care about most are Power, Temps, and Usage and that is easily monitored with this dashboard!