Prometheus Docker
Prometheus is a tool for monitoring and collecting data about your systems and applications. It helps you track performance and visualize metrics using graphs and dashboards. It has an integration as a "Data Source" for Grafana, which we will be using in this guide.
We need to set up a Prometheus Docker container. If you have multiple PCs you want to monitor, you can set it up so you just have a single Prometheus instance, or you can have multiple. In this guide I will be using a single Prometheus instance. Select a host for Prometheus and create a folder to store a Prometheus config
mkdir ~/prometheus
Create Config
I prefer to store my prometheus config in my home directory. If you previously installed Prometheus via apt or another package manager it may already have a config file at /etc/prometheus/prometheus.yml. Most guides use that location as well. It really does not make a difference as far as I can tell.
Then create and open the config file
nano ~/prometheus/config.yaml
Now we need to specify a few things, and overtime we will add more to this file. To start, we want to add some global settings to scrape the metrics every 15 seconds and our first job which is for Prometheus itself:
global:
  scrape_interval: 15s

scrape_configs:
  - job_name: 'prometheus'
    static_configs:
      - targets: ['172.20.0.10:9090']
Press CTRL + x and then y to save and exit.
This configuration snippet for Prometheus sets a global scrape interval of 15 seconds, meaning Prometheus will collect metrics from configured targets every 15 seconds. The scrape_configs section defines a job named 'prometheus,' which includes a static target located at 172.20.0.10:9090, allowing Prometheus to gather metrics from that specific address. The IP address 172.20.0.10 is one I chose, and in the next step you will see how to set it up.
Create the Docker Network
I prefer to use a custom network specifically for monitoring inside Docker. You can create a new network that will allow you to use the IP shown above by running
sudo docker network create \
  --driver bridge \
  --subnet 172.20.0.0/16 \
  --gateway 172.20.0.1 \
  monitoring-network
This creates a new network called "monitoring-network" using the subnet 172.20.0.0/16 and the gateway 172.20.0.1. I prefer to keep all my monitoring on its own network.
You can choose a different subnet, gateway, and network name, but make sure to update the IP address and network name in future commands to reflect it.
Create Prometheus Container
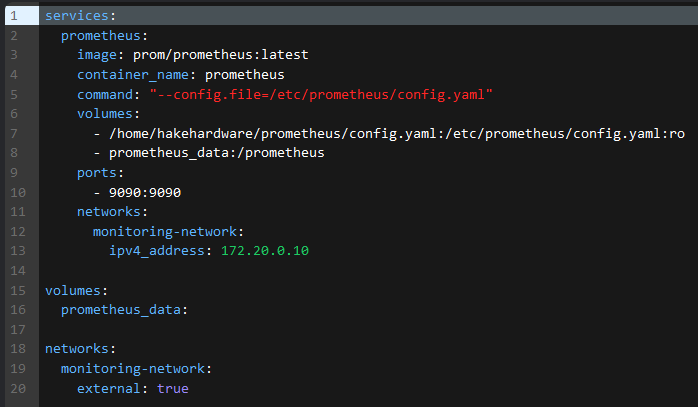
Inside Portainer, open the environment (PC) where you will be deploying Prometheus. Then create a new stack file called "prometheus". Then open up the prometheus.yaml file hosted on my github
Copy that, and paste it into the Portainer web editor. Make the following changes:
- Update
</PATH/TO/PROMETHEUS.YAML>under volumes to be the actual FULL path. You can runpwdin the folder with your prometheus.yaml file to get the full path. - Set the
<NETWORK NAME>under the BOTHnetworkstomonitoring-networkor whatever you have named your network (note there are 2 sections this needs to be done)
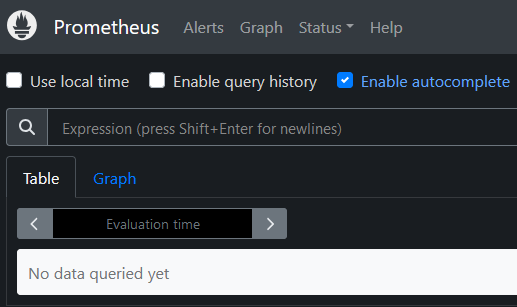
Now deploy the the container and check to make sure it started

You can also confirm it is running by typing in the IP address of the PC hosting Prometheus and the port (9090) into your web browser. If you are on the PC hosting Prometheus, you should use the IP of the Docker container.
That is it for setting up Prometheus. We will come back and edit the config.yaml for Prometheus as we add more jobs.