Prometheus Monitoring (Non-Cluster)
Introduction
In this guide we will cover how to monitor your Node and Farmer with Prometheus and Grafana
Prerequisites
Prior to using this guide you should have Prometheus set up as a service:
You should also have Grafana running via one of the following methods
Expose Metrics
Enable Metrics
If following my guides, the Node and Farmer are already set to expose metrics. If not following my guides metrics can be enabled by adding the --prometheus-listen-on flag.
Node
--prometheus-listen-on 127.0.0.1:9080
Farmer
--prometheus-listen-on 127.0.0.1:9081
Restart Node/Farmer
Restart your Node & Farmer after making the above changes.
Update Config
The Prometheus config file must be updated to include the endpoints for the Farmer and Node metrics.
Open Config
Open up the config which is located at C:\Prometheus, right click on the prometheus.yml file and then select "Edit in Notepad".
Update Config
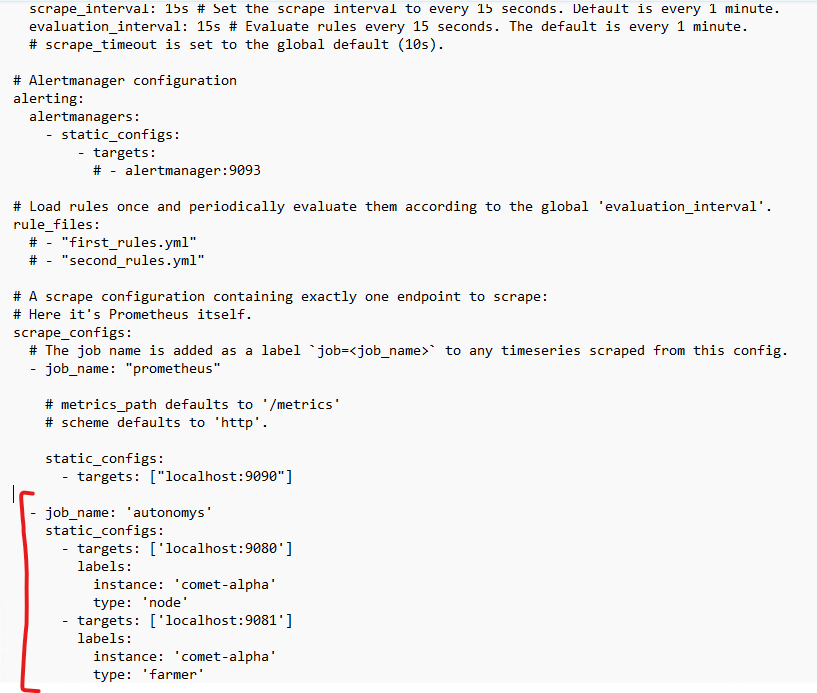
Go to the bottom and add the following job
  - job_name: 'autonomys'
    static_configs:
      - targets: ['localhost:9080']
        labels:
          instance: 'comet-alpha'
          type: 'node'
      - targets: ['localhost:9081']
        labels:
          instance: 'comet-alpha'
          type: 'farmer'
It should look something like this
Restart Prometheus
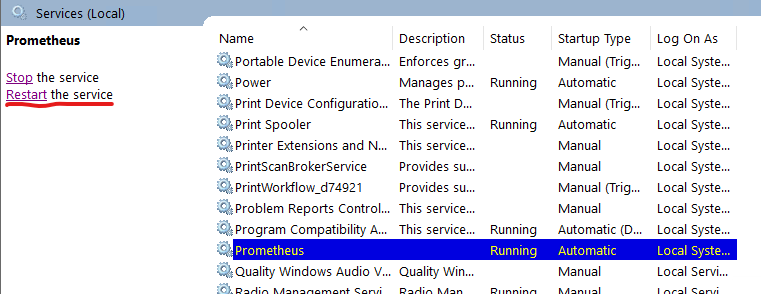
Then restart Prometheus in the Services console by searching for services.msc in the start menu.

Then find the Prometheus service and click "restart"
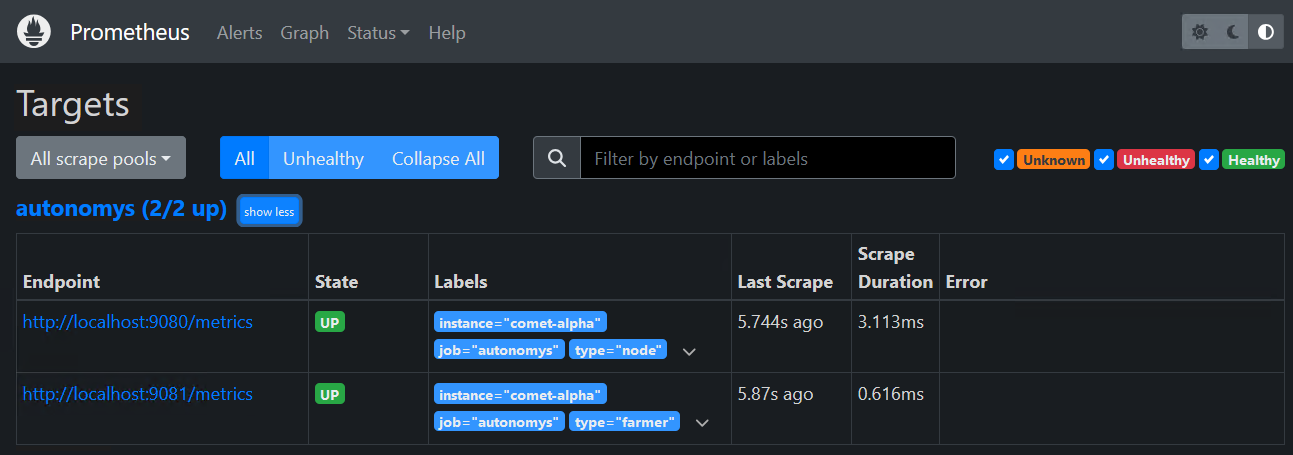
Verify Targets
You can verify the updates were successful by checking the Promethues Targets page on the Web frontend (Status > Targets)
Grafana
Import Dashboard
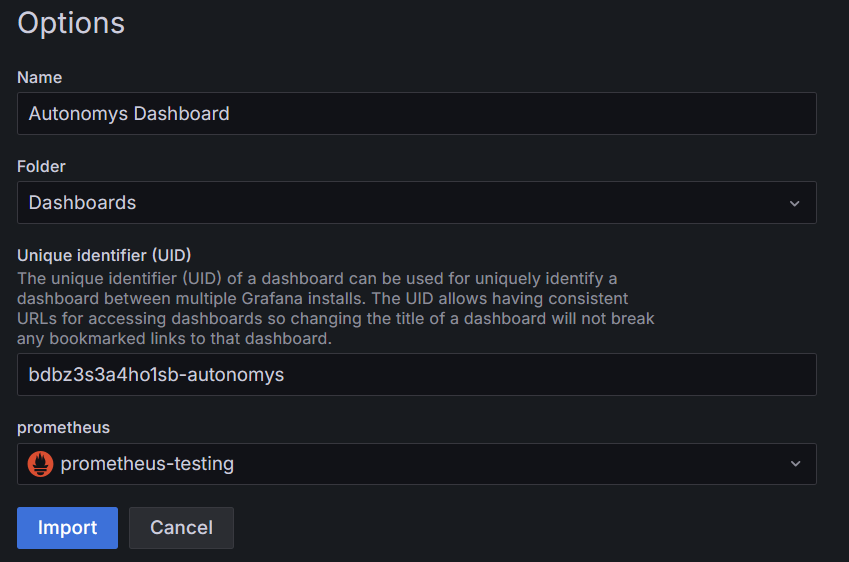
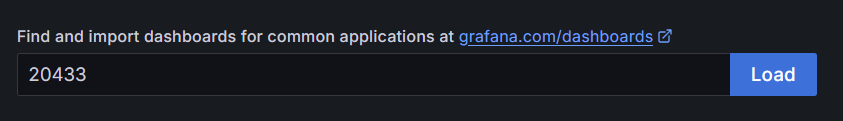
In Grafana the Autonomys dashboard can now be imported. Select the "Dashboard" menu item. Then "New", and then "Import". For the "dashboard URL or ID" enter "20443". Then click load.
The dashboard is a bit old, but it is currently the best option. Update the name to something like "Autonomys Dashboard". Then add something to the uid to make it unique. Finally, select the Prometheus data source previously set up and click "Import".